Peel Region Real Estate Comparison Dashboard
Motivation
Recently, I have been interested in the real-estate market. Many of the websites I use to look at listings, such as realtor.ca, zolo.ca, and zillow.com provide plentiful information about the listing itself, such as the number of rooms, the property type, the amount of property taxex, the list price, and some stats about the neighbourhood. As a potential homebuyer, all of these details may help you with your purchasing decisions.
However, what I was interested in knowing was how a listing might compare to other homes in the market. More specifically, I wanted to know if a home was fairly priced based on comparable homes that were available. The goal of this project was to create a dashboard where I can select a listing, and compare the list price against similar homes that are available.
Technologies Used
Different technologies were used to complete this project. Below is a list of technologies and products that were used.
Programming Languages: Python, SQL, CSS
Data Processing: PySpark
Data Visualization: Plotly, Dash
Relational Database: PostgreSQL
Cloud: GCP - Cloud Storage, Cloud SQL, Dataproc, Compute Engine, Cloud Run
Data Generator: Synth
Orchestration: Airflow
Other: Terraform, Docker
About the Data
Ideally, I would like to use data from real listings from a multiple listing service. It would be even better if I had access to sold listings data. However, to get access to this data in Canada, you either need to be a member of a real estate board, or pay for an API that provides access. I am neither a real-estate agent, nor did I want to pay for an API while I built out a proof-of-concept.
My solution was to use a data generator. The generator of choice was Synth, which is an open-source tool that provides a command line tool to generate data. Synth takes in a schema, which defines the column names and data types for each field, and generates random data accordingly. You can read more about Synth here.
I want to reiterate that the listings in the app are completely fake and do not represent real-world addresses.
Having looked at several listing websites, I had a general idea of what information is usually present in a listing. This guided me on what fields I needed to generate. While there are many different listing details that I could have included, I stuck to a few that I felt were most relevant to potential homebuyers. This included the address including street name, street number and city, the list price, the number of rooms, the property type, the square footage, the list date, and the age of the home. As a proof-of-concept, I started with these listing details, and would look to add more in the future.
Data Pipeline
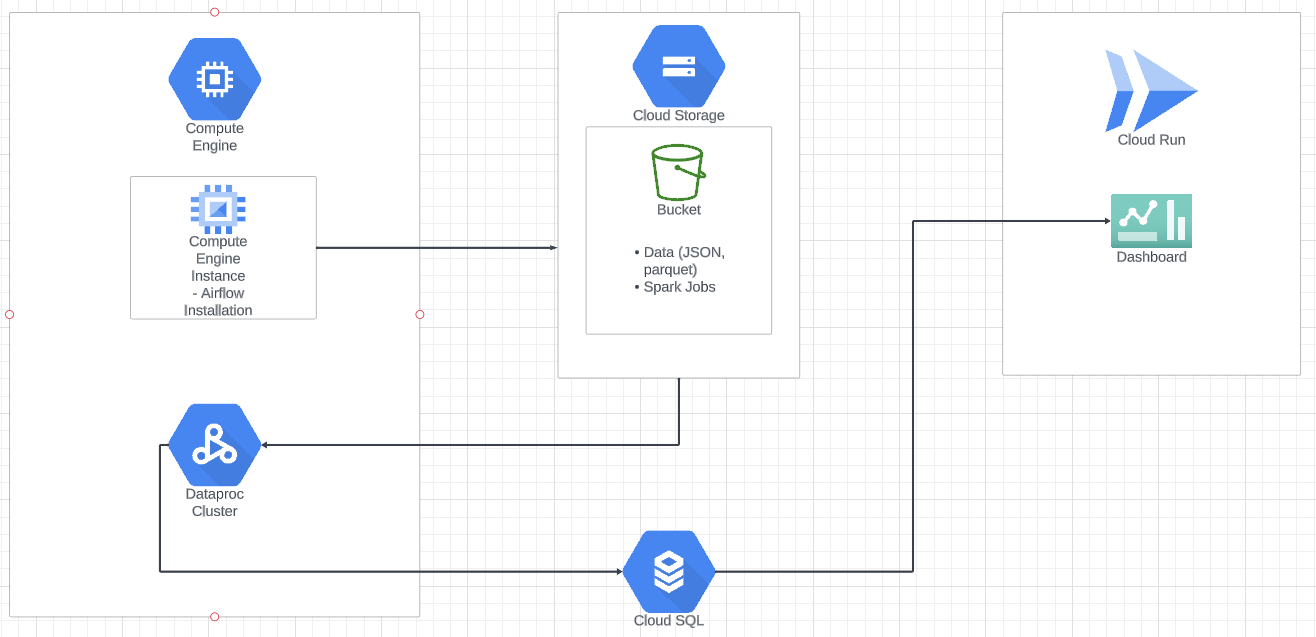
The first step in the data pipeline was to generate the listings. The generated listings were saved to JSON files locally before they were uploaded to cloud storage. Next, transformations were applied to the raw listings to add details like the age range and square footage range of the listing. As part of the transformations, a field for the list price was created using a custom function that created realistic (or at least more realistic than a completely random number) list prices based on the size of the home and property type. These transformations were completed using PySpark, and the transformed data was loaded into a Postgres database. I wanted to simulate listings being updated or removed from the database, so two additional PySpark jobs were created which would update and delete a small random percentage of listings from the database.
Two additional tasks are included in the pipeline, which involved the Spark cluster creation and deletion. To keep costs low, the Spark cluster is created when the DAG is triggered, and is torn down once all the Spark related tasks are complete.
The data pipeline was orchestrated using Airflow, and it runs four times a day.
Provisioning Cloud Resources
A number of cloud resources were used for this project. I chose to go with GCP as they provide a $300 credit for new users. Terraform was used to provision a Cloud Storage bucket, and a Cloud SQL Postgres instance. I initially set up Airflow locally, but to ensure my pipeline was running when my computer went to sleep or powered down, I later provisioned and installed Airflow on a Compute Engine instance. As mentioned earlier, PySpark was used to process the raw listings, and a Dataproc cluster was provisioned and torn down after the PySpark jobs were completed as part of the data pipeline.
Other GCP products used include Cloud Run to deploy the app, Artifact Registry to store the container image for the app, and Secrets Manager to prevent credentials being stored as plaintext in the source code.
Dashboard and Web App
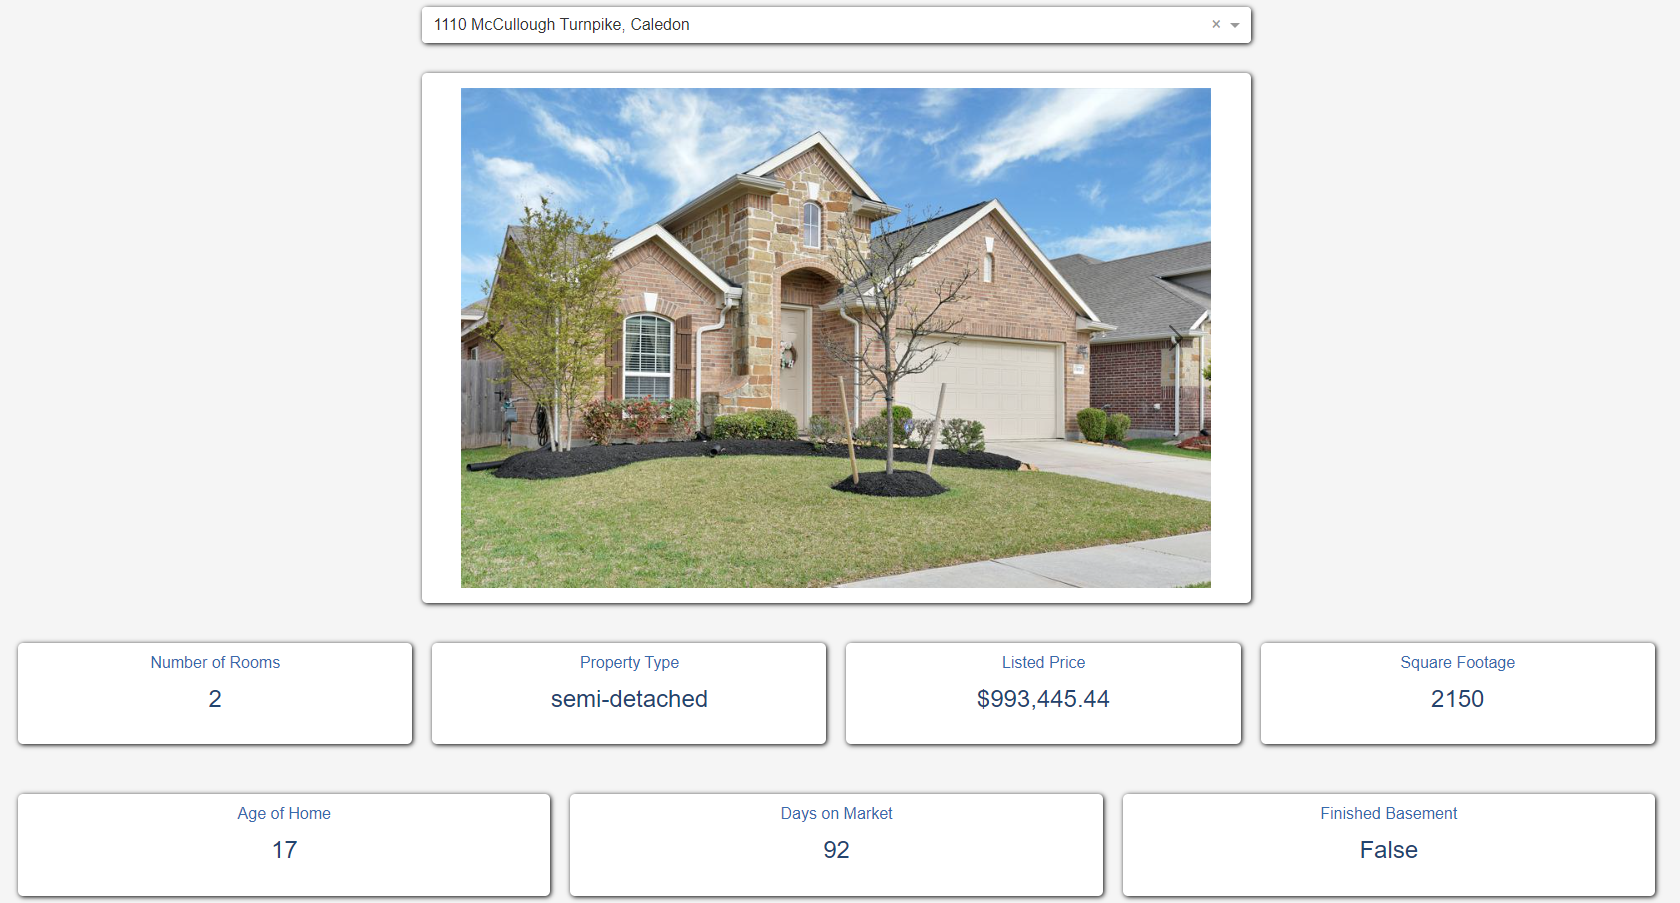
The dashboard was built using Plotly and Dash. Data is pulled from the Cloud SQL database to populate the fields in the dashboard. Users can either search for or select a listing by address from the dropdown menu and the dashboard will display its listing details.
What is ‘Similar’?
For the purpose of this dashboard, a listing is considered similar to the selected listing if it is in the same city, and is the same property type (semi-detached, townhome or single detached).
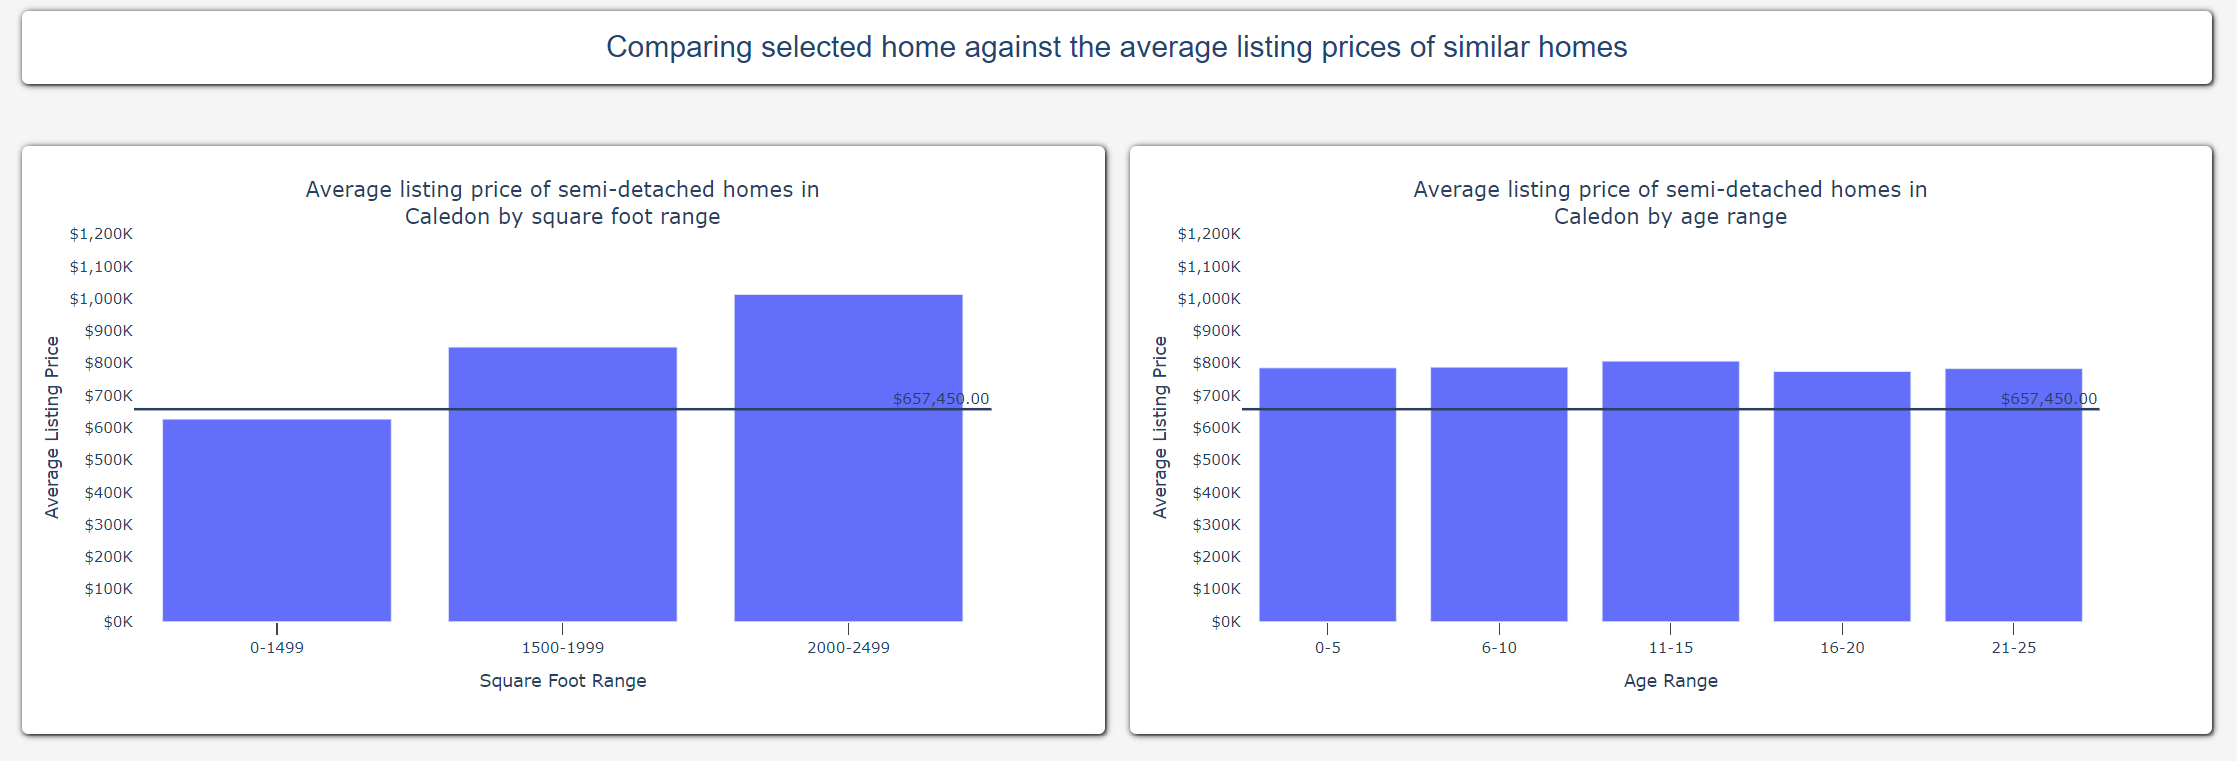
The two bar graphs at the bottom of the dashboard compares the selected listing against similar homes in the database. The bar graph on the left compares the list price of the selected listing against the average price of other listings in the same city grouped by the Square Foot Range. Similarly, the bar graph on the right compares the list price of the selected listing against the average price of other listings in the same city grouped by Age Range.
Using these bar graphs, users can get an indication of whether a listing is under- or over-valued when compared to similar homes on the market.
Key Takeaways
The dashboard allows users to gauge whether a property is listed fairly by comparing it against similar homes, albeit using generated data. The insights derived from data analysis is only as good as the quality of the data itself, so using actual listing data would provide more meaningful conclusions.
The generated data contained a small set of listing details. In the future, I would love to speak with subject matter experts like real-estate agents to validate that the information that is currently displayed affects the number of viewings a property has, and ultimately, help sell the property. I’d also like to ask if there are other key details that are missing and should be included in the dashboard.
Another group of people I’d like to speak with are potential homebuyers. I’d like to know what listing information is important to them when they are considering different homes on the market. I can include those details in the dashboard as well to help them make more informed decisions.
I learned a lot from this project. Developing on the cloud is a very different experience from developing on a local machine - I never had to worry so much about networking! You can read a more in-depth breakdown of my key learnings in this blog post here.


